How To Check Which Cell Network Works Best in Your Area
Key Takeaways
- The best mobile network depends on your exact location, daily routine, and real-world signal quality, not national rankings or ads.
- Combining coverage maps, third-party apps, phone signal readings, and local feedback gives the most accurate picture of network performance.
- Choosing a flexible carrier that lets you switch networks makes it easier to adapt as coverage, travel, or living situations change.
If you have ever switched phone plans only to realize your service got worse, you already know this truth: the “best” network is not universal. It is personal. Coverage that feels flawless in one neighborhood can be frustrating two blocks away, and national ads do not always reflect real-life performance.
At RedPocket, we see this all the time. That is why we focus less on hype and more on helping people figure out what actually works where they live, work, commute, and travel.
The good news is you don’t need to guess. With the right mix of tools and a little real-world testing, you can confidently find the network that delivers the strongest signal and most reliable service in your area.
Below is a simple, step-by-step way to do exactly that.
Start With Carrier Coverage Maps
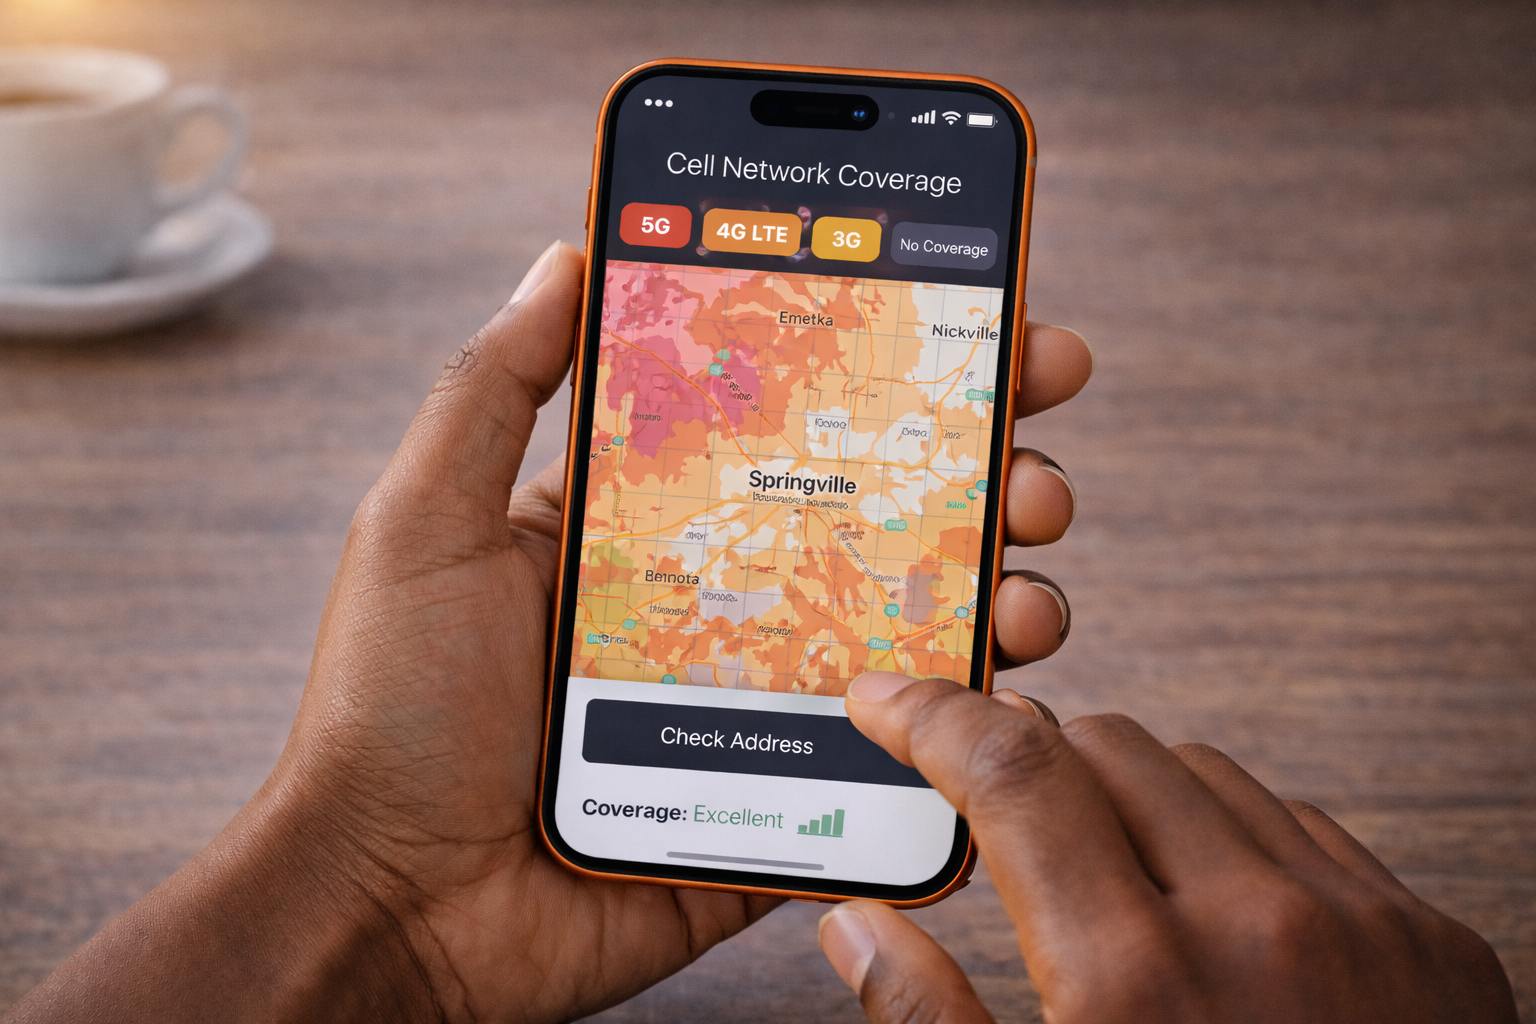
Coverage maps are the best first stop because they show where a network claims to work before you test it yourself.
A carrier coverage map is an interactive online tool that shows where a mobile network offers LTE, 4G, and 5G service, along with areas of stronger or weaker signal. Each major network publishes one, and they are worth comparing side by side.
As you look, based on our experience in early 2026:
- Verizon maps tend to show strong rural and highway coverage
- AT&T often performs well in metro areas and suburbs
- T-Mobile typically shines in dense urban locations with newer 5G infrastructure
Zoom in beyond your city name. Check your exact ZIP code, nearby streets, and places you spend time, like work, school, or family homes. Small differences matter more than national averages.
Once you have a sense of which networks should work nearby, RedPocket’s coverage and compatibility tools make it easy to see which options fit your phone and location without locking you into a contract.
Use Third-Party Apps for Real-World Data
Coverage maps are helpful, but they are still marketing tools. To see how networks actually perform day to day, third-party apps are where the truth lives.
These apps use crowd-sourced data from real users to show signal quality, speed, and reliability in specific locations. That means apartments, offices, coffee shops, and neighborhoods, not just highways.
Popular options include:
- OpenSignal, which compares signal strength and speeds across carriers
- CellMapper, which shows nearby towers and how the signal changes block by block
- RootMetrics, which publishes independent network performance reports
- FCC Broadband Map, which provides official coverage data by technology type
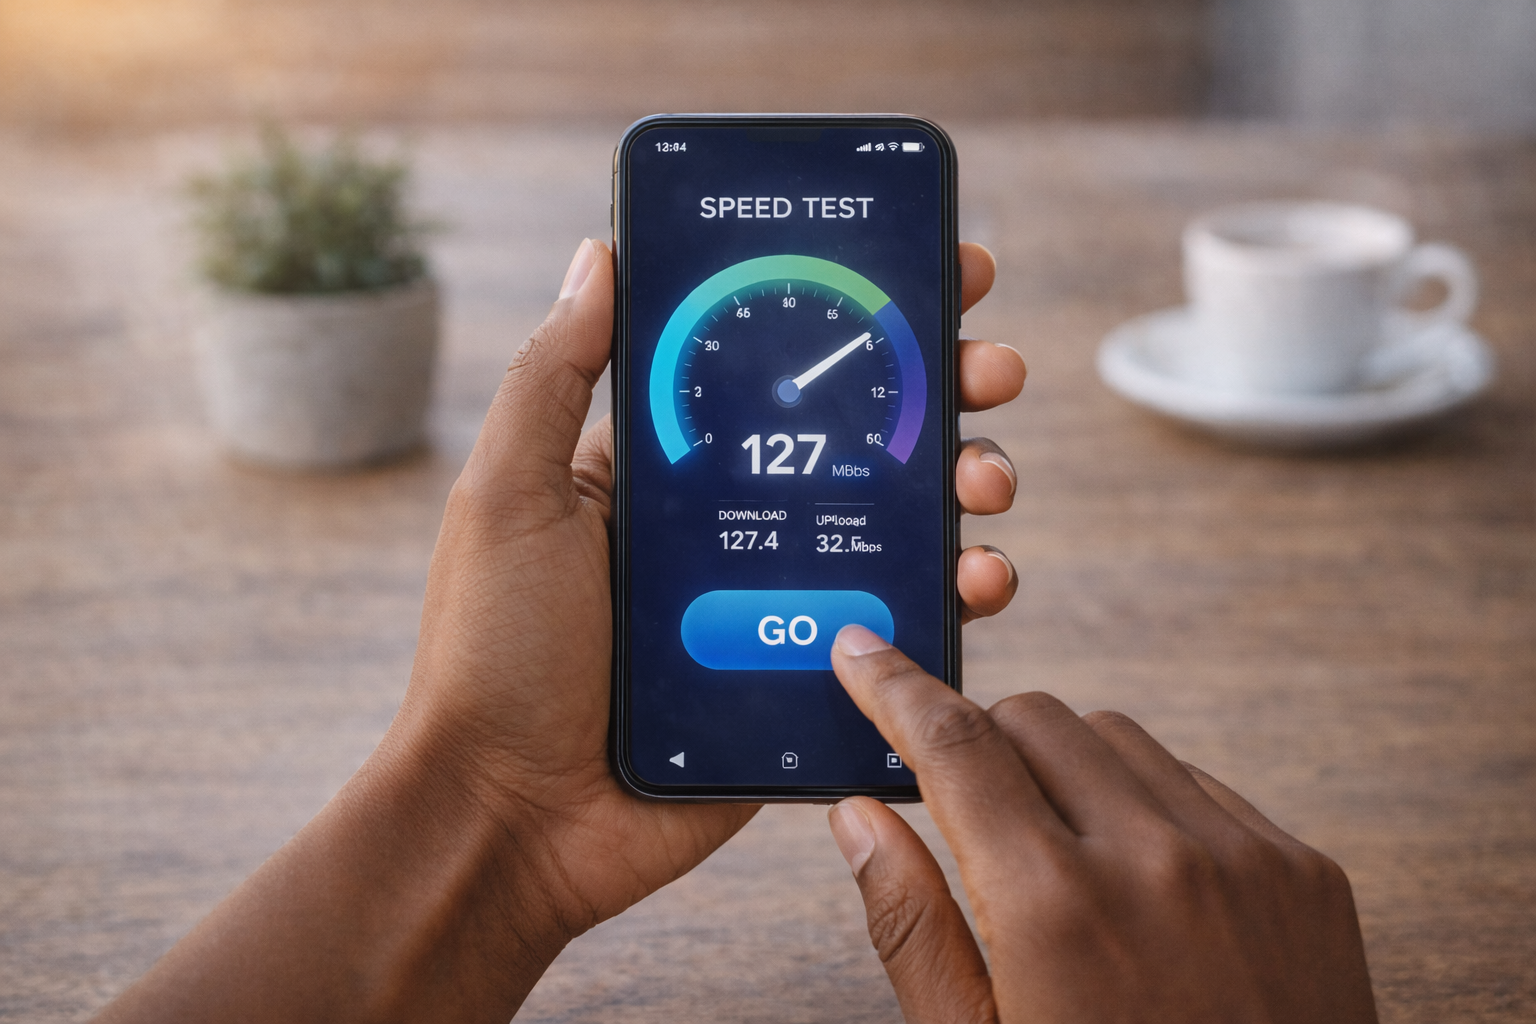
- Ookla Speedtest, which lets you test upload, download, and latency in real time
Using even one of these tools can reveal things coverage maps cannot, like weak indoor service or congestion during busy hours.
Measure Signal Strength on Your Phone
If you want the most hands-on answer, your own phone already has it.
Signal strength is measured in dBm, which tells you how strong your connection is to the nearest tower. The closer the number is to zero, the stronger the signal.
As a quick guide:
- Better than –85 dBm usually feels strong
- –86 to –100 dBm is usable but can fluctuate
- Weaker than –100 dBm often leads to dropped calls or slow data
On iPhone, you can access Field Test Mode by dialing 3001#12345# to view signal strength in dBm. On Android, apps like Network Cell Info or OpenSignal make this easy without digging through menus.
Try checking your signal in different places and times. Morning, evening, inside your home, and outside can all look different. Patterns matter more than a single reading.
Gather Local User Feedback
Data is powerful, but nothing replaces lived experience.
Ask neighbors, coworkers, or friends nearby what their service is actually like. Pay attention to comments about dropped calls, slow data at night, or dead zones inside buildings. These details rarely show up on maps.
Online communities help too. Searching phrases like “best carrier in [your city]” on Reddit, Facebook groups, or local forums often surfaces honest feedback from people dealing with the same streets and towers you are.
If several people mention the same issue, believe them.
Combine Data for a Complete Coverage Picture
The smartest move is not relying on one source but stacking them.
Use coverage maps to narrow options. Use apps to see real-world performance. Check your phone’s signal. Listen to local experiences. Together, they tell a much clearer story than any single tool.
This is also where flexibility becomes powerful. With RedPocket, you are not locked into one underlying network. If your area changes, your routine shifts, or coverage improves elsewhere, tools like CoverageGenius let you switch networks without starting over or signing contracts.
That freedom turns coverage testing from a one-time gamble into an ongoing advantage.
Frequently Asked Questions
How do I use coverage maps to compare mobile networks?
Coverage maps help you visually compare where each network offers strong, moderate, or limited service so you can narrow down which carriers are most likely to work in your area.
Which apps best show real-world network quality near me?
Apps like OpenSignal, CellMapper, and RootMetrics use crowd-sourced data to show how networks perform in real locations, including indoors and busy neighborhoods.
How many speed tests should I run for accurate results?
Run several tests at different times of day and in multiple locations. One test shows a moment. Patterns show reality.
Sources:
Mobile LTE Coverage Map | Federal Communications Commission
Speedtest by Ookla | Apps on Google Play
USA, January 2025, Mobile Network Experience Report | Opensignal
Understanding Decibels and Their Use in Radio Systems | FCC